
The 2027 Latin America
Tech Hiring Report
Why US companies are hiring senior engineers in Latin America, and why cost is no longer primarily the reason.
Contents
The engineering bottleneck has moved
In 2026, the engineering hiring problem tends to be less about finding people who write code and more about finding people who decide what to build, verify that it works and own the outcome. The gap is finding senior engineers with good judgment.
“A novice doesn't have the skill to correct the AI and the return on pairing them is negative. More iterations, more failures, more bloat and debt. For now, the solution is to focus on developers who know wrong when they see it.”
Jeremy McEntire · VP of Engineering, Wander
What we found
1. Demand is becoming more senior. Indeed Hiring Lab data show that in Q1 2026, 69.3% of software-development job postings were classified as senior-level, making software development the occupational category with the highest concentration of senior-level postings.
2. AI raises the relative value of judgment and experience. In highly AI-exposed occupations, employment among workers aged 22 to 25 fell 19% below its expected trajectory, with no comparable gap among more experienced workers.
3. Latin America now has a technical base built over decades. Multinational investment, homegrown companies and technical education help explain why the region's digitally delivered services exports grew from US$18.5 billion in 2005 to US$87.7 billion in 2024.
4. Time zone and economics change what an engineering budget can buy. Working the same hours makes experience usable at the moment of decision. That is why the unit that matters shifts from the cost of an hour to the capability the budget puts to work.
Four decisions this report should change
1. Hire for judgment, not volume. Assess architecture, integration and technical ownership, not only how much code a person ships.
2. Budget for seniority before maximizing headcount. More people without depth increase the need for direction instead of expanding team capability.
3. Treat time zone as an operational requirement. In architecture, production, security and integration, shared hours change how fast experience turns into decisions.
4. Measure capability, not just cost. The cheapest hour rarely buys the most capable team.
Accessing this talent still requires closing the operational gap between the US company and the engineer: reputation, sourcing, payroll, onboarding, hardware and customs, and ongoing support.
1
The shift
What is happening to engineering demand in the United States, and why.
Section 1 · Part A
The world is shifting: the senior engineering constraint
If you lead an engineering team, you may have already noticed a pattern: the roles that matter most tend to require experience, take longer to fill and cost more. Companies have almost always preferred small engineering teams. What has changed is how those teams are composed.
Before and now
During the last decade of expansion, many organizations structured their software teams as a pyramid: a broad base of junior and mid-level engineers executed, and a smaller group of seniors set direction. The model made sense in a context where producing code consumed much of the engineering effort.
Recent signals suggest a different composition. Between May 2025 and May 2026, 71% of the increase in US software-development job postings came from senior roles. Recent growth is therefore concentrated among more experienced professionals rather than distributed evenly across seniority levels.
Figure 1
The shift in demand for senior engineers
Technical demand is moving toward more experienced professionals, and seniority has become a critical resource.
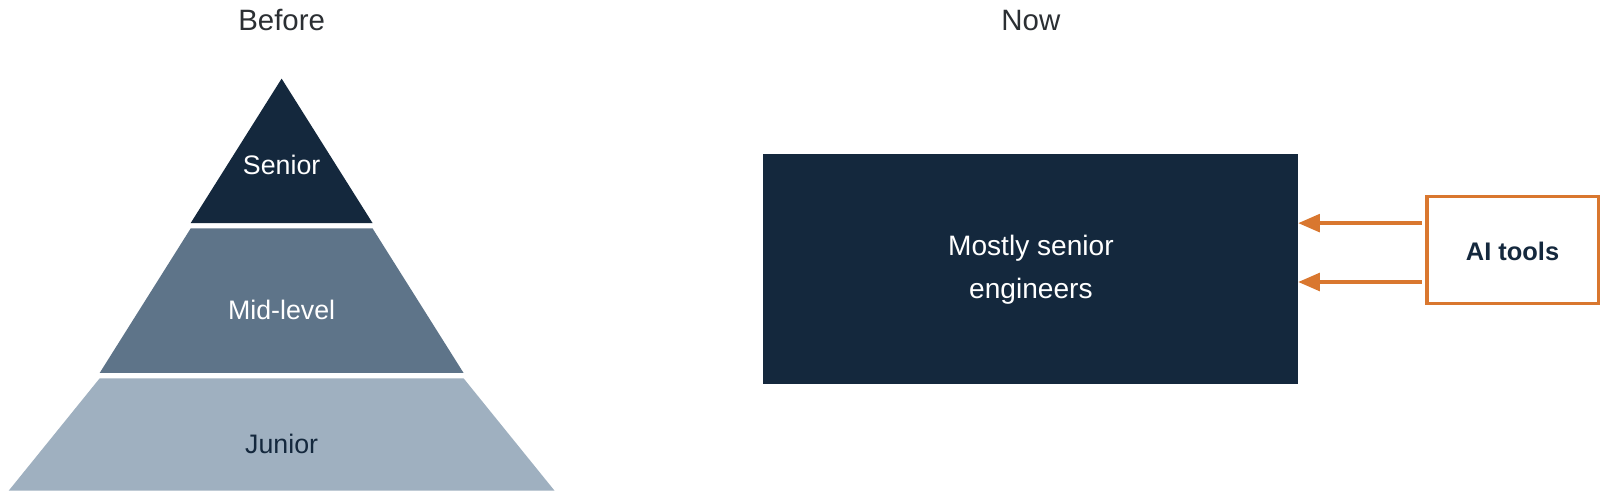
Chart labels: Before · Now · Senior · Mid-level · Junior · Mostly senior · engineers · AI tools
Sources: LinkedIn Economic Graph; Harvard; Y Combinator Jobs; a16z and Sequoia portfolio jobs. Illustrative team structures.
“No engineering team should be larger than what can be fed with two pizzas, keeping groups small enough to maintain high trust, fast decision-making, and clear ownership.”
Jeff Bezos
In the US, senior talent is expensive and harder to access
The Bureau of Labor Statistics puts the median software developer salary at US$135,980 a year in 2025, which we use as our mid-level reference.
“Senior engineers, especially 10x engineers can often earn significantly more than the mid-level median SWE due to the gap in skills”
Brian Samson · Founder, Plugg Technologies; former four-time VP of Talent in San Francisco
The top 10% earn more than US$214,670. In the San Francisco Bay Area, where equity and bonuses weigh more, median total compensation for software engineers is around US$280,000, according to Levels.fyi (accessed October 21, 2026).
The cost of living in these markets adds pressure. In the Bureau of Economic Analysis regional price parities, California's overall price level is 10.7% above the national average, and its rent index reaches 154.3.
Senior and technical roles take longer to fill
Ashby's 2026 Recruiting Operations Benchmarks show that technical roles take a median of 75 days from job opening to first hire, compared with 60 days for business roles. Across job functions, senior positions take 37% longer to fill than junior roles. These longer hiring timelines reinforce the importance of planning ahead when recruiting for experienced technical talent.
Demand is shifting faster than experience can be built
Indeed Hiring Lab data show that senior-level job postings rose 14.7% year over year through May 2026. In software development, 69.3% of postings were senior-level in Q1 2026. In Indeed’s methodology, senior roles typically require five or more years of experience or advanced specialized knowledge, so the experienced-talent pipeline cannot expand at the same speed as a sudden shift in demand. Lower entry-level hiring today can also narrow the pool from which future senior engineers emerge.
Chart
Senior roles take longer to fill
Median days from job opening to first hire, across job functions.
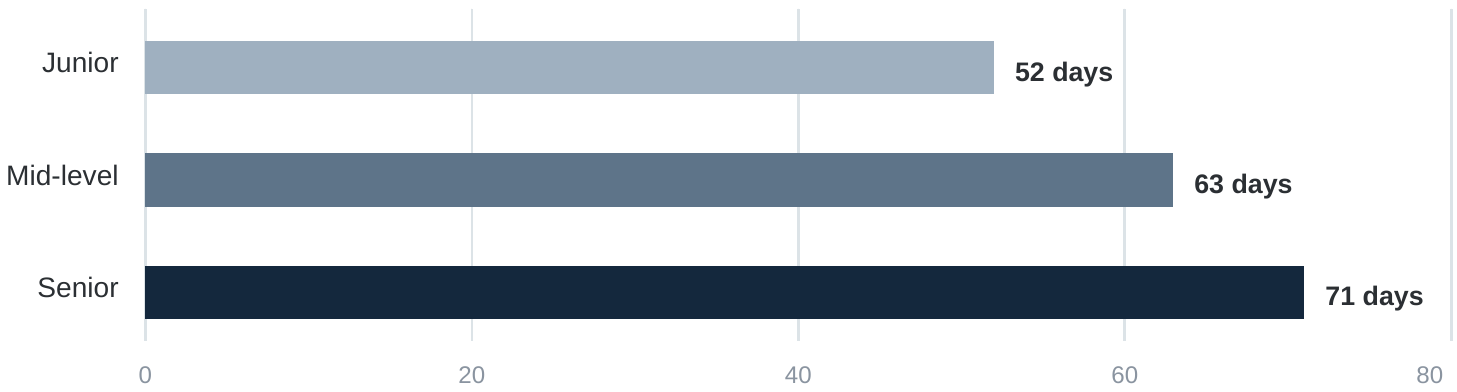
Chart labels: Junior · 52 days · Mid-level · 63 days · Senior · 71 days · 0 · 20 · 40 · 60 · 80
Source: Ashby, Recruiting Operations Benchmarks, May 2026. Figures represent all job functions, not software engineering alone. Time to First Fill measures the period from job opening to the first hire.
Figure 2
The US senior talent constraint
US companies need senior talent at the moment it has become more expensive, more contested and harder to access.
Engineering level | Median salary | High salary |
|---|---|---|
Mid-level software engineer | US$135,980 | US$175,500 |
Senior software engineer | US$190,372 | US$245,700 |
Sources and methodology: mid-level median reference, BLS, 2025; mid-level high benchmark, Robert Half, 2026. The senior figures are Plugg estimates, calculated by applying a 40% markup to their respective reference values, and are not published by BLS or Robert Half.
Figure 2A
Hiring timelines and senior-level demand
75 days
Median time to first fill, technical roles (Ashby, 2026)
69.3%
Senior-level software-development postings (Indeed Hiring Lab, Q1 2026)
Sources: Ashby, 2026 Talent Trends Report; Indeed Hiring Lab. Metrics use different methodologies and are not added together.
Plugg data · Seniority mix of LATAM technical job openings as a trend
Year | Openings | Senior roles | Senior share | |
|---|---|---|---|---|
2024 | 261 | 67 | 26% |
|
2025 | 309 | 139 | 45% |
|
2026 YTD (through September 30, 2026) | 390 | 281 | 72% |
|



Plugg Technologies analyzed technical job openings handled through its LATAM recruiting operations between 2024 and 2026. Senior-level roles represented 26% of openings in 2024, increasing to 45% in 2025 and 72% in 2026 year-to-date (through September 30, 2026). These findings reflect Plugg's customer demand rather than the entire LATAM hiring market.
Source: Plugg Technologies Applicant Tracking System and placement data.
How we know this · U.S. Bureau of Labor Statistics (2025); Levels.fyi; U.S. Bureau of Economic Analysis; Y Combinator; Indeed Hiring Lab (2026); Plugg proprietary data.
Section 1 · Part B
Why: AI puts the spotlight on skills
AI is making code cheaper to produce and engineering judgment more valuable.
AI tools have been accelerating code production significantly. But generated code still depends on someone who can answer questions the tools cannot resolve on their own:
What should we build?
Is the architecture right?
Is the AI-generated code actually good?
How does it integrate with existing systems?
What are the security implications?
What happens when it breaks?
Who owns the outcome?
All of these questions depend, to a large extent, on experience. The faster code reaches production, the higher the cost of getting any of them wrong.
Figure 3
From code production to engineering judgment
As AI lowers the cost and time of producing code, the relative value of senior judgment rises.
Code production
Writing functions, tests and documentation
→
Engineering judgment
Architecture, integration, review, security, failure resolution, ownership of the outcome
Sources: Stanford Digital Economy Lab; Google DORA 2025; METR; World Economic Forum.
What the evidence shows
In August 2026, the Stanford Digital Economy Lab updated its study Canaries in the Coal Mine? with ADP payroll data through June 2026. Among workers aged 22 to 25 in highly AI-exposed occupations, employment fell 19% below the trajectory it would have followed alongside same-age peers in less exposed occupations. Experienced workers showed no comparable gap.
The adjustment came mainly from fewer hires of young workers rather than more layoffs. The revision also shows that young employment fell in occupations built on codified knowledge, while it grew among experienced workers in occupations that depend on tacit knowledge: what is learned through practice, mentorship and repeated exposure to real situations.
The authors treat the results as descriptive.
Research from Harvard points in the same direction. Studying US résumé and job posting data, Seyed Mahdi Hosseini Maasoum and Guy Lichtinger found that after firms adopt generative AI, junior employment declines relative to non-adopting firms, while senior employment remains relatively stable. The effect is stronger in more GenAI-exposed occupations, and it appears mainly through slower junior hiring rather than increased separations.
Google's 2025 DORA research reinforces this distinction: AI adoption is widespread and developers report productivity gains, while confidence in AI-generated code remains uneven. METR adds another caution from a different angle: in a randomized study of experienced open-source developers working in familiar codebases, developers using early-2025 AI tools took 19% longer to complete the studied tasks. Together, the findings suggest that AI can amplify engineering work without eliminating the value of context, judgment and experience.
The demand
“There's a fight for senior experienced software engineers and there's disinterest in junior software engineers.”
The value of experience
“But in order to be really good at using AI to write a lot of code, you gotta have experience writing code.”
David Friedberg
Former CEO, The Climate Corporation · Co-host, All-In Podcast
Source: The Diary of a CEO · youtube.com/watch?v=OYg6BTjb90E&t=4615s
AI in the technical hiring mix
The World Economic Forum places AI and machine learning specialists and software developers among the fastest-growing roles through 2030. LinkedIn found AI Engineer among the fastest-growing roles in 15 of the 21 countries analyzed, at the top of the list in the United States.
Beyond these broader indicators, Plugg's direct experience with US clients offers a closer look at the technical profiles companies are actually seeking. Ruben Santana, President of Plugg Technologies, describes what the recruiting team has observed in recent searches.
“What I'm seeing are a lot of data jobs. It's data engineers, data analysts, all different types of data-related positions that are leading towards being able to develop more AI-related functionality.”
Ruben Santana · President, Plugg Technologies
Source: Nearshore Café Podcast
The distinction matters: the evolution of technical hiring is visible not only in positions explicitly labeled as AI roles, but also in the skills and responsibilities companies seek across their engineering teams.
At the same time, demand for dedicated AI specialists is accelerating. LinkedIn data cited by The Economist shows that postings for heads of AI, AI engineers and directors of AI have roughly doubled since 2023–24.
“Demand for AI talent is outpacing supply, with companies globally looking to hire quality AI engineers.”
Evan Meyers · Director of Nearshoring Solutions, Plugg Technologies
Source: youtube.com/watch?v=aDxvJO7cVqc
Beyond whether an engineer can build the system, it increasingly matters whether they can use AI effectively, evaluate what it produces and own the outcome.
How we know this · Stanford Digital Economy Lab (revision of Aug. 12, 2026); Hosseini Maasoum and Lichtinger, Harvard University (2025, rev. 2026); Google DORA (2025); METR (2025); World Economic Forum (2025); LinkedIn, Jobs on the Rise 2025; The Economist (2026); The Diary of a CEO; Nearshore Café Podcast; Plugg proprietary data.
2
The senior talent base
Why Latin America now has the experienced engineering talent this market requires, what it costs and how to access it.
Section 2 · Part A
Latin America is ready to meet this demand
For a long time, the region was associated mainly with bug fixing and legacy code maintenance. That perception may have reflected part of the market two decades ago. It increasingly fails to describe what US companies hire for today.
Today's senior population comes from investments made 20 years ago
Senior talent takes time to develop. In general, it grows when engineers spend years at companies that demand global standards, systems at scale and products with real users. Digitally delivered services exports from Latin America and the Caribbean jumped from US$18.5 billion in 2005 to US$87.7 billion in 2024, according to a joint report by the IDB, the World Bank and the WTO.
Companies that helped build Latin America's senior talent base
Google acquires Akwan in Belo Horizonte in 2005 and opens its first Latin American R&D center there in 2006.
Microsoft
35 years in Brazil and 40 years in Mexico.
Mercado Libre, Nubank and Rappi
Operate large systems and have helped develop engineers used to that level of complexity.
Figure 4
How Latin America built its senior talent base
Today's availability of experienced technical talent is the result of years of ecosystem development, not a recent cost-driven shift.
Global tech companies in Latin America
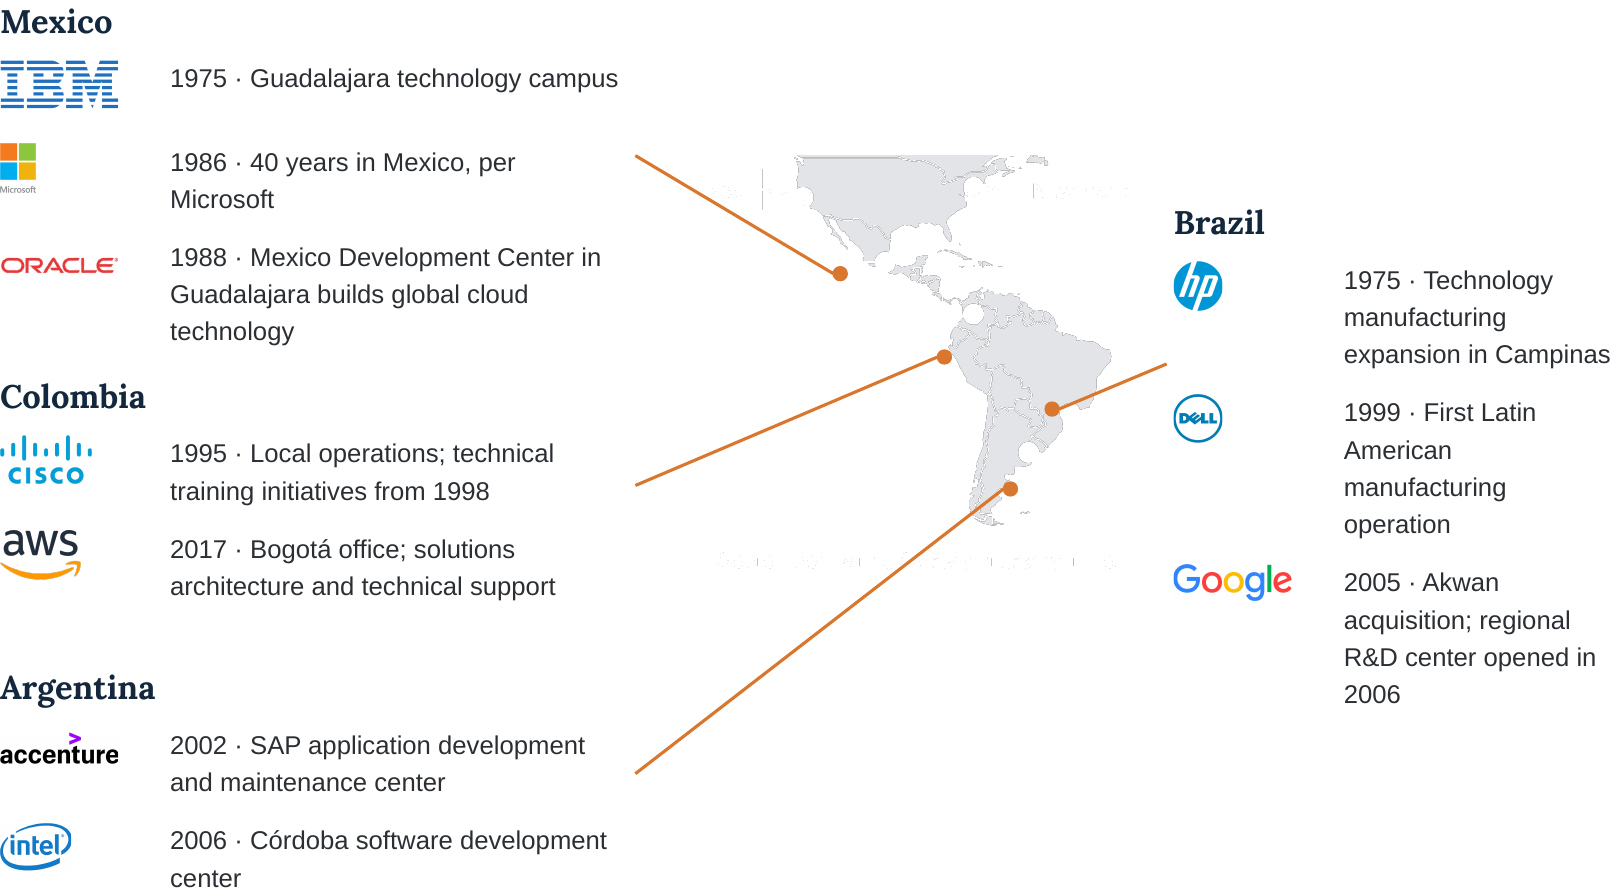
Milestones mark documented technology-related operations in each country; an office, a manufacturing plant and a software engineering center are distinct kinds of presence and are described as such. Sources: company and public historical documentation for HP, IBM, Microsoft, Oracle, Cisco, Dell, Accenture, Google, Intel and AWS; IDB, World Bank and WTO (2026); LAVCA, 2026 Latin American Startup Ecosystem Insights; World Bank/UNESCO; MIT REAP.
Leading Tech Companies Founded in Latin America
 US$72.1B
Market cap · Oct 2026
Nubank Brazil · Founded 2013 · Digital banking
Provides app-based banking and financial services, including credit cards, digital accounts and lending. By the end of 2025, it served 131 million customers across Brazil, Mexico and Colombia, demonstrating the scale of Latin American financial technology.
 US$93.2B
Market cap · Oct 2026
Mercado Libre Argentina · Founded 1999 · E-commerce / Fintech
Operates Latin America's leading e-commerce marketplace alongside Mercado Pago, its digital payments and financial services platform. Its marketplace spans 18 countries, requiring sophisticated technology for commerce, payments and logistics at regional scale.
 US$5.25B
Last disclosed private valuation · Jul 2021
Rappi Colombia · Founded 2015 · Technology platform
Operates an on-demand delivery and digital commerce platform connecting consumers, merchants and couriers. Its services span nine Latin American countries and include food delivery, groceries and other transactions supported by a regional technology infrastructure.
 US$1.6B
Market cap · Oct 2026
Globant Argentina · Founded 2003 · Software engineering / IT
Provides software engineering, digital transformation and AI services to global companies. Founded in Argentina, it has grown into a technology organization with more than 28,700 employees across over 30 countries.
 ~US$4.6B
Market cap · Oct 2026
TOTVS Brazil · Founded 1983 · Enterprise software
Develops enterprise software for managing finance, operations, HR and industry-specific processes. Its technology serves more than 70,000 businesses across 12 sectors.
Technology companies founded in Latin America. Market capitalizations are as of October 2026; Rappi is private and its figure is the last disclosed valuation, from July 2021, and is not comparable to a market capitalization. Sources: company market data via stockanalysis.com (Nubank, Mercado Libre, Globant, TOTVS); TechCrunch (Rappi, July 2021).
“Fintech and e-commerce have been sort of the two big pillars of the Latin America startup scene over the last 10 years.”
Dave McClure
Source: Nearshore Café Podcast, VC Investing in LATAM (2023)
What U.S. Technology Leaders Should Know About the Largest Talent Pockets in Latin America
Latin America's engineering talent has developed within sophisticated urban ecosystems shaped by universities, multinational companies, homegrown businesses and innovation institutions. Four cities offer a closer look at the professional environments where the region's technology workforce builds careers and contributes to global industries.

Paseo de la Reforma, Mexico City.
Mexico City Mexico
Mexico City's engineering ecosystem draws on a strong academic foundation, an established corporate presence and the scale of a major international capital.
Institutions such as UNAM and the National Polytechnic Institute contribute to its technical talent base, while corporate districts such as Paseo de la Reforma reflect the city's role as a major business center.

Avenida Brigadeiro Faria Lima, São Paulo.
São Paulo Brazil
São Paulo's Faria Lima corridor reflects the corporate and investment environment surrounding the city's wider technology ecosystem. Innovation institutions such as Cubo Itaú connect startups, established corporations and investors.
Founded in 2015, Cubo Itaú connects a community of more than 500 startups from 18 countries, illustrating how the city's innovation infrastructure brings entrepreneurs, technology companies and capital together.

Puerto Madero, Buenos Aires.
Buenos Aires Argentina
Buenos Aires combines a longstanding engineering tradition with an international business environment. Puerto Madero's contemporary architecture illustrates one part of the city's urban and corporate landscape.
Elsewhere in Buenos Aires, the Distrito Tecnológico, established in 2008, has grown into a center for software and technology businesses. The district hosts more than 280 companies, illustrating the sector's integration into the city's economy.

La Alpujarra, Medellín.
Medellín Colombia
Medellín's evolving urban landscape, seen here in the La Alpujarra district, reflects a broader period of development alongside technology institutions and business initiatives supporting its economic transformation.
Ruta N, the city's innovation center, connects businesses, universities and public institutions to support entrepreneurship, technological development and international collaboration.
Technical talent at scale
GitHub recorded 3.2 million new developers in Latin America between 2024 and 2025. In 2025, Brazil reached 6.89 million and became the platform's fourth-largest market worldwide. GitHub cites remote hiring by US and European companies among the drivers of this growth.
Figure 5
Latin American technical talent at scale
Latin America already has meaningful technical scale, and Plugg data shows how that capacity appears in real hiring.
Country | GitHub developers (2024) | YoY growth (2024) |
|---|---|---|
Brazil | > 5.4M | +27% |
Mexico | > 1.9M | +21% |
Argentina | > 1.1M | +22% |
Colombia | > 1.0M | +25% |
Plugg data · 85.5% of classified placements are IT roles (94 of 110).
Sources: GitHub Octoverse 2024 (GitHub’s 2024 reporting period runs Oct. 1, 2023–Sept. 30, 2024); IDB, World Bank and WTO; Plugg. "Developer" means an active GitHub account, not an employed workforce.
Plugg data · Technical Roles in Demand in the 2020s
Plugg's job activity includes highly complex technical roles such as Data Architect, Enterprise Architect, GCP Engineer/Architect and Senior ReactJS Architect.
Source: Plugg Technologies Applicant Tracking System data.
Ecosystem development and technical education
Higher education also expanded significantly. Gross tertiary enrollment in Latin America rose from 23% in 2000 to 54% in 2020, according to the Inter-American Development Bank.
Leading technical universities. Representative examples include USP, Unicamp, ITA, UNAM, Tecnológico de Monterrey, UBA and Universidad de los Andes.
The MIT relationship. The MIT Regional Entrepreneurship Acceleration Program works with regions to develop innovation ecosystems. Its 2025 global cohort included regional teams from Brazil and Mexico.
The pandemic put time zone in the spotlight
The pandemic made it common to have engineers outside the office. An Inter-American Development Bank study using LinkedIn data from seven Latin American countries documented the rapid expansion of telework during the pandemic, particularly in professional services. With physical distance no longer an obstacle, another criterion gained weight: working the same hours. The pandemic revealed time zone. AI revealed skills.
Sources: Inter-American Development Bank, A World of Transformation: Moving from Degrees to Skills-Based Alternative Credentials (tertiary enrollment); MIT Sloan Global Programs, MIT REAP Cohort 12 announcement (2025); Inter-American Development Bank, The Transition to Telework in Latin America and the Caribbean: Key Findings Using LinkedIn Data (2023; data covering 2020 to April 2022).
The challenge
“Time zone was the biggest challenge that we had… we had a few hours of overlap every day when working with Eastern Europe.”
The advantage
“We wanted to find someone that was in similar time zones… we just wanted more overlap… you want to be able to just chat or say, ‘Hey, let’s get together and chat about something,’ not have to wait till the next day, which made Latin America perfect.”
Kevin Haggard · VP of Engineering, Zengines AI
Source: Nearshore Café Podcast
Figure 6
Time zone as an operational advantage
Time zone proximity turns technical experience into capability available during the client's work cycle.
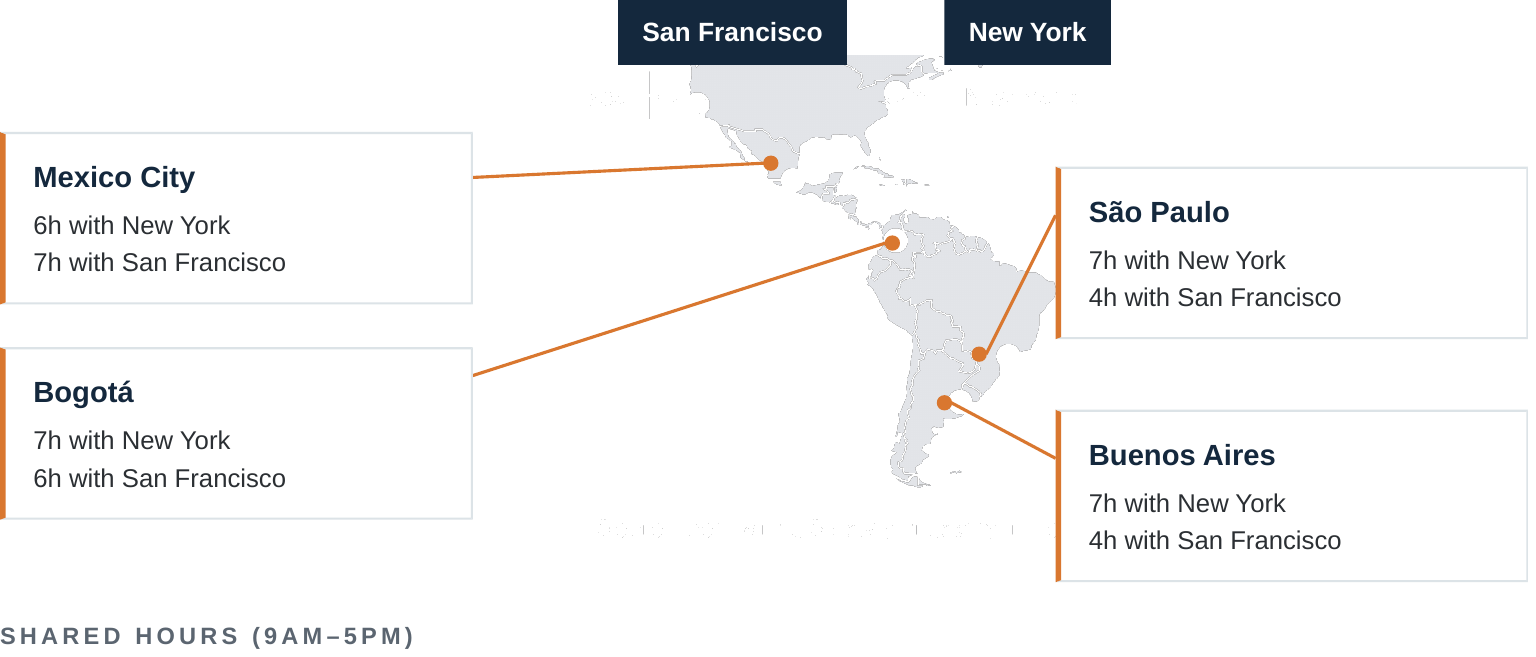
Sources: NIST (US time zones). Reference: September, with US daylight saving time.
Doing business got easier. Not easy.
Ten years ago, hiring an engineer in another country often required a local entity or improvised payment workarounds. Today, platforms such as Deel and Multiplier offer contracts and payments in several countries in the region. Labor, tax and currency complexity still exists, but the barrier to entry is lower.
“Companies are moving whole teams from India and the Philippines to Mexico and Argentina and so forth because they want that time zone alignment.”
Brian Samson · Founder, Plugg Technologies
Source: youtube.com/watch?v=JE3LJPubYw4
Meanwhile, the global sourcing map is reorganizing
US companies can draw on several technical talent hubs around the world, and each offers its own combination of advantages. India, Central and Eastern Europe, Africa and China have broad, experienced engineering communities and remain sound choices for many types of work.
What changed is the relative weight of some criteria. When demand concentrates on senior judgment and real-time collaboration, companies tend to evaluate regions along dimensions such as:
Dimension | What the company evaluates |
|---|---|
Time zone overlap | How many hours of the workday are shared with the US team |
Compensation trend | How talent costs have been evolving in each market |
Geopolitical exposure | How sensitive operations are to external events and trade policy changes |
Sourcing ecosystem maturity | Track record of engineering partnerships with US companies |
Cross-border infrastructure | Ease of hiring, paying and supporting professionals in the country |
Technical talent availability | Depth and seniority of supply in the target roles |
Collaboration model | Fit for synchronous or asynchronous work |
Regulatory environment | Predictability of rules on data, intellectual property and hiring |
No region wins on every dimension. For asynchronous, well-scoped work, more distant hubs may offer the best combination. For roles where judgment must be available during the US workday, Latin America brings together time zone proximity, growing technical scale and increasingly mature operating infrastructure.
Figure 7
Latin America's digital services exports have grown nearly fivefold
Digitally delivered services exports, US$ billions.

Chart labels: 2005 · US$18.5B · 2024 · US$87.7B · Growth 2005–2024 · 374%+
Source: IDB, World Bank and WTO, Digital Trade in Latin America and the Caribbean (2026). Coverage is Latin America and the Caribbean. The series measures digitally delivered services exports, not software engineering employment or IT outsourcing specifically.
“Each region brings a powerful thing to the table. Colombians are very creative. Argentinians are very bold thinkers. Think outside of the box. Mexicans are very entrepreneurial.”
Stewart Wolfenson
Source: Nearshore Café Podcast, Where Should You Outsource in 2025? (2025), approx. 15:41
How we know this · IDB, World Bank and WTO (2026); GitHub Octoverse 2024 and 2025; Microsoft; Google; Oracle; Mercado Libre; Rappi; Nubank; Globant; TOTVS; LAVCA, 2026 Latin American Startup Ecosystem Insights; World Bank/UNESCO; MIT REAP; NIST; Kearney (2023); Nearshore Café Podcast; Plugg proprietary data.
Meet the publisher
About Plugg Technologies
The organization publishing this report, and the people who lead it.
Plugg Technologies
Plugg Technologies is a U.S.-based nearshore staffing firm specializing in connecting American companies with highly skilled software engineers and technology professionals across Latin America. Through staff augmentation and dedicated nearshore teams, Plugg helps businesses access experienced talent while benefiting from geographic proximity, overlapping time zones, and competitive hiring costs.
With recruiting operations spanning multiple LATAM countries, Plugg combines firsthand regional knowledge with a consultative, hands-on approach to sourcing, hiring, onboarding, and supporting distributed teams. Plugg successfully hires over a hundred LATAM professionals each year for its clients.
Beyond staffing, the company publishes research and industry insights through its Nearshore Café podcast, featuring more than 90 conversations with technology executives, entrepreneurs, investors, and regional experts.
Click here to talk to Plugg about building your LATAM team
Brian Samson, Founder

Founded Plugg Technologies and hosts the Nearshore Café podcast.
Relocated from San Francisco to Buenos Aires in 2015 to co-found a FinTech company. Grew it from 0 to 85 engineers.
Served in executive roles at VC-backed startups and earned an MBA from UCLA Anderson.
12 years building in LATAM, including hiring hundreds of engineers and adjacent professionals.
Ruben Santana, President

Leads Plugg Technologies as President, bringing more than 30 years of experience in IT staffing and talent acquisition.
Built and led a nearshore recruiting operation of more than 25 recruiters in Monterrey, Mexico.
Directed staffing delivery, global MSP services, and operations in senior leadership roles.
Led cross-border technology initiatives and helped shape nearshore workforce strategies across Latin America.
Section 2 · Part B
Countries, economics and capacity per dollar
What you need to know to compare markets, understand pricing and size what an engineering budget can build in the region.
Country guides
Mexico | Brazil | Argentina | Colombia | |
|---|---|---|---|---|
Population (2025) | ~131.9M | ~212.8M | ~45.9M | ~53.4M |
GitHub developers (2024) | > 1.9M | > 5.4M | > 1.1M | > 1.0M |
English proficiency (EF EPI 2025, of 123 countries) | 103rd | 75th | 26th | 76th |
Time zone (September) | UTC−6 | UTC−3 | UTC−3 | UTC−5 |
Sources: World Bank, World Development Indicators, Population, total (SP.POP.TOTL), 2025; EF English Proficiency Index 2025; GitHub Octoverse 2024.
Quality of life
The region's main tech hubs combine universities, global companies, scaled startups and a vibrant urban life. For a US company, this matters for a practical reason: these factors can help cities attract and retain skilled professionals.
City | Human capital (2026) | Quality of life (2026) |
|---|---|---|
Mexico City | 70.6 | 48.8 |
São Paulo | 62.8 | 50.0 |
Buenos Aires | 64.1 | 73.4 |
Medellín | 52.6 | 45.5 |
Source: Oxford Economics, Global Cities Index 2026. Category scores range from 0 to 100 and do not represent assessments of individual technology professionals.
“I wanted people that would align with the continental United States… people that were really good at English, trustworthy, and reasonable rates. That was really my criteria.”
Paul Karaffa · CEO, Cloud Pacific
Source: Nearshore Café Podcast
Pricing
In the US, technical experience consumes budget quickly. The median software developer salary is US$135,980, while the top 10% earn more than US$214,670. For senior-level comparisons, Plugg applies a 40% markup to Robert Half's US$175,500 high benchmark, resulting in an estimated annual salary benchmark of US$245,700. In the San Francisco Bay Area, median total compensation for software engineers is around US$280,000, according to Levels.fyi.
Plugg’s contractor data shows that technical talent pricing varies meaningfully by seniority, role and specialization, and local market. Rather than a single regional rate, the data shows how different talent profiles occupy different pricing ranges.
Figure 8
What senior talent costs in Latin America
US$ Hourly cost (contractor pay) · US$ Client bill rate (client is charged)
1 · Seniority
Junior | US$11–18 | US$27–32 | n = 7 |
|---|---|---|---|
Mid | US$21–23 | US$30–34 | n = 5 |
Senior / Lead | US$30–38 | US$44–52 | n = 33 |
2 · Role / technical specialization
QA / Testing | US$15–17 | US$23–27 | n = 51 |
|---|---|---|---|
Salesforce | US$18–33 | US$30–44 | n = 54 |
Software Development | US$22–38 | US$34–52 | n = 72 |
Data / BI / AI | US$22–35 | US$33–47 | n = 14 |
Cloud / DevOps / Infrastructure | US$26–37 | US$45–55 | n = 6 |
3 · Geography / local market
Mexico | US$15–30 | US$25–43 | n = 136 |
|---|---|---|---|
Brazil | US$24–41 | US$42–55 | n = 22 |
Typical range = 25th–75th percentile of observed Plugg rates within each group. Seniority uses only roles with an explicit level in the job title. Hourly Cost is contractor pay; Bill Rate is the client rate. Group sample sizes are shown above.
Source: Plugg proprietary contractor data. The original contractor extract contains 330 records; sample sizes for each reported group are shown above. This contractor pricing analysis is distinct from the 960 technical job openings analyzed in the annual seniority trend.
Table
2026 LATAM technology hiring: hourly rates by country and role
Median hourly client bill rates in USD, based on an illustrative sample of contractor engagements.
Technical role | Mexico | Brazil | Colombia |
|---|---|---|---|
Sr Backend engineer | $42 (43) | $52 (10) | $37 (12) |
Salesforce developer | $37 (51) | $46 (14) | $40 (9) |
QA engineer | $28 (52) | $32 (12) | $28 (10) |
AI / Data engineer | $54 (18) | $64 (11) | $52 (8) |
DevOps engineer | $48 (15) | $55 (10) | $47 (7) |
What does it cost to hire a software engineer in Latin America in 2026? In this illustrative example, Plugg Technologies' contractor records show median client bill rates of $38 per hour in Mexico, $52 in Brazil, and $37 in Colombia for software engineers and adjacent IT roles. These figures represent observed client billing rates, not employee salaries or nationally representative market averages.
Figures in parentheses are the number of engagements behind each median. Source: Plugg Technologies contractor records. The country medians quoted above are reported separately by Plugg and are not calculated from the five role-level medians in this table.
Figure 8 reports observed rate distributions by broader seniority, specialization and geographic groupings, while this table presents separately supplied role-by-country medians. Their sample sizes and rates should not be directly reconciled without confirming the underlying record selection, job-title classification and coverage periods.
In a Nearshore Café discussion, KPMG executives Jean-Pierre Trouillot and Alan Riddell described rising investor confidence and a gradual recovery in Latin American M&A activity. Trouillot pointed to a survey of 400 executives showing increased optimism, while Riddell highlighted attractive acquisition valuations and improvements in workforce capabilities, noting that labor costs and investment risks remain important considerations.
Jean-Pierre Trouillot · Deal Advisory Partner, KPMG LLP; Regional Advisory Leader, KPMG Americas
Alan Riddell · Head of Deal Advisory & Strategy, KPMG in Brazil and South America
Source: Nearshore Café Podcast, Latin America M&A Outlook 2026.
https://plugg.tech/latin-america-ma-nearshoring-2026/
Capacity per dollar
The relevant economic unit is not the cost of an hour. It is the level of capability the budget can put to work.
The traditional nearshore comparison sets one hour against another. That works for procurement, but not for an engineering decision. A CTO is not handed an hour to spend. They are handed a budget, a technical need and a set of risks.
The question that matters is: what can an engineering budget already approved in the US build in Latin America?
Unit of comparison | What it shows | What it hides |
|---|---|---|
Hourly rate | The price of an hour of work | Whether the hour produces a decision or just a ticket |
Annual salary saved | Budget slack in the first year | Seniority, coverage and replacement risk |
Capacity per dollar | Seniority, coverage and depth the budget reaches | Requires a defined budget and technical need |
Optionality | Which combinations of capability the budget makes possible | Does not replace assessing the quality of each hire |
Figure 9
Capacity per dollar: what the same budget buys
The relevant economic unit is not the cost of an hour, but the level of capability the budget can put to work.
1 · Seniority
The level of technical capability the budget reaches
2 · Real-time coverage
How much of that capability is available in the client's work cycle
3 · Operating capacity
How much work, decision-making, review and ownership the budget sets in motion
US equivalent employer cost
~US$173/h
Salary + employer costs
vs.
LATAM Senior / Lead client bill rate
US$44–52/h
Plugg observed range (Figure 8)
→
Same budget
~3.3×–3.9×
more senior engineering hours
Budget capacity at observed rates, not a measure of individual productivity.
Sources: Plugg proprietary contractor data; Robert Half, 2026 Salary Guide; U.S. Bureau of Labor Statistics, Employer Costs for Employee Compensation.
How we make the comparison
A US salary and a LATAM contractor bill rate are not directly comparable. For the US side, we use Robert Half's 2026 High salary benchmark for Software Engineers, US$175,500, as the starting reference. Plugg applies an additional 40% adjustment to estimate a US senior engineering salary benchmark of US$245,700. This adjusted figure is a Plugg estimate, not a salary benchmark published by Robert Half.
BLS employer compensation data for Professional, Scientific and Technical Services show that wages account for 68.3% of total employer compensation. On that basis, US$245,700 in estimated salary corresponds to approximately US$360,000 in annual employer cost, or about US$173 per equivalent hour based on 2,080 hours per year.
Plugg's observed Senior / Lead client bill rate in Latin America is US$44–52 per hour. On this basis, the same budget can fund approximately 3.3×–3.9× more senior engineering hours in Latin America.
Illustrative scenario
Capacity per dollar: an illustrative scenario
What a US$1M annual budget can buy
United States
~2.8 senior engineer equivalents

US$1M ÷ ~US$360,000 annual employer cost ≈ 2.8
Latin America
Approximately 10 senior engineers

US$1M ÷ (US$44–52/h × 2,080 hours) ≈ 9.2–10.9
Illustration of budget capacity using Plugg's estimated US senior engineering salary benchmark (US$245,700), derived from Robert Half's 2026 High benchmark (US$175,500) with a 40% adjustment. The estimated US annual employer cost is approximately US$360,000 (~US$173/h), compared with Plugg's observed LATAM Senior / Lead client bill rate of US$44–52/h. This represents approximately 3.3×–3.9× more senior engineering hours, not a measure of individual productivity, skill equivalence or quality.
How we know this · Plugg proprietary data (contractors and placements); Robert Half, 2026 Salary Guide; U.S. Bureau of Labor Statistics; Levels.fyi; U.S. Bureau of Economic Analysis; GitHub; EF English Proficiency Index 2025.
Section 2 · Part C
How Plugg solves the operational problem
With more than 12 years of experience operating across Latin America, Plugg's leadership understands the complexities of cross-border hiring and the importance of local expertise.
Access to senior engineering talent is only part of the equation. Successfully hiring and supporting that talent requires local credibility, effective sourcing, reliable payroll, seamless onboarding, equipment logistics, and ongoing operational support.
Plugg bridges this operational gap, turning access to talent into a reliable, fully supported hiring process.
Reputation and credibility in the region
Huge US brands can be unknown in Latin America. A senior engineer in São Paulo or Mexico City receives many approaches and has little reason to trust a company they have never heard of. Plugg builds credibility in the region by paying on time, keeping its promises, and staying present after the hire.
“U.S. Tech companies are often surprised by how hard it is to establish credibility with LATAM talent. The success these companies had in the U.S. doesn't immediately translate and they often need to start from zero, even billion dollar brands”
Sandra Marquez · Talent Branding Lead, DoorDash & Zillow
Source: Nearshore Café Podcast, unpublished interview provided by Plugg Technologies.
Sourcing capability for the most contested roles
AI, architecture and cloud concentrate the competition for talent. Plugg recruits from a network of tens of thousands of engineers across Latin America, built over more than a decade of searches in the region, and delivers a shortlist in 3 days on average.
Payroll
Plugg facilitates payroll across a dozen Latin American countries.
Onboarding
The first hire is usually working within 14 days. Onboarding is bilingual and includes preparing access before day one.
Hardware and customs
Shipping a laptop to another country involves import taxes and customs timelines that can delay the first day of work. Plugg handles shipping and equipment setup.
White-glove service
Every search is built around the client's hiring bar, with no bench of candidates pushed onto the client. Plugg stays involved after onboarding.
“We’ve added strong Rails engineers and QA professionals who are engaged in our culture, ask thoughtful questions, and contribute ideas.”
Jordan Krey · VP of Engineering, SingleOps
Source: Plugg Technologies, Client Testimonials. https://plugg.tech/
3 days
average shortlist
14 days
average placement
91%
retention
94%
client satisfaction
500+
placements
Source: Plugg Technologies, internal operating data.
2026 YTD technical job openings data (see pages 7 and 29): through September 30, 2026.
Click here to talk to Plugg about building your LATAM team

About this research
Methodology and limitations
This report combines three layers of evidence. First, data from public agencies, academic research, multilateral organizations and platforms with data at scale, which establish the trends. Second, the interpretation of engineering leaders, founders and investors. Third, Plugg proprietary data, which shows how these trends appear in real hiring. This report draws on data and research available through 2026, including Plugg's 2026 year-to-date hiring data through September 30, 2026.
Plugg dataset | Size | Use |
|---|---|---|
Classified placements | n = 110 | Geography and role type |
Original contractor extract | n = 330 records | Figure 8: pricing by seniority, technical specialization and geography; reported group-specific sample sizes |
Country-by-role pricing illustration | Sample sizes shown in individual table cells | Plugg-supplied illustrative median client bill rates, page 24; source extract and inclusion rules require confirmation |
Job activity, 2024–2026 (earlier reported extract) | 330+ roles, 3,613 submissions | Seniority |
Annual seniority mix, 2024–2026 YTD | 261, 309 and 390 technical openings (960 in total) | Senior share of openings by year |
Plugg's historical experience (500+ placements) is institutional context and is not the same as the datasets analyzed.
Senior share of openings. The 26%, 45% and 72% figures measure the share of senior-level roles among the technical job openings Plugg's LATAM recruiting operations handled in each year: 67 of 261 openings in 2024, 139 of 309 in 2025 and 281 of 390 in 2026 year-to-date. Those 960 are job openings, not contractor pricing records. They describe the composition of Plugg's own client demand in a given year. They are not a measure of the Latin American hiring market. The 110 classified placements, 330-record contractor extract and 500+ historical placements are separately reported measures and should not be treated as interchangeable with the annual openings series.
Capacity per dollar. The US salary estimate is based on Robert Half's 2026 High salary benchmark for Software Engineers (US$175,500), adjusted upward by 40% under Plugg's senior engineering benchmarking assumption, resulting in US$245,700. This adjustment is a Plugg estimate, not a figure reported by Robert Half. BLS employer compensation data for Professional, Scientific and Technical Services, where wages are 68.3% of total employer compensation, convert that estimate to approximately US$360,000 in annual employer cost, or about US$173 per hour at 2,080 hours per year. That figure is compared with Plugg's Senior / Lead client bill rate (US$44–52/h), not contractor hourly cost. The resulting 3.3×–3.9× measures how many engineering hours a budget can fund, not productivity.
Limitations
Correlation is not causation. When the data shows simultaneous movements, we use "is consistent with" or "suggests".
"Senior" is not a standardized category. Plugg's seniority figures come from its annual ATS and placement series, which record the seniority assigned to each opening at the time it was created. This report does not state a single fixed definition of senior applied across years and clients.
GitHub accounts are not an employment census. They include students and non-employed profiles.
Plugg samples. Hundreds of records corroborate trends measured in millions, but do not prove them on their own. The geographic concentration of placements reflects where Plugg recruits.
Declaration of interest. Plugg operates as a nearshore technology talent partner in Latin America. This report combines Plugg's proprietary hiring and placement data with external evidence from academic, government, multilateral, and corporate sources to analyze market shifts and show how they appear in real hiring activity.
Sources
Sources
Source | Section |
|---|---|
Stanford Digital Economy Lab, Canaries in the Coal Mine? (revision of Aug. 12, 2026) | 1B |
Seyed Mahdi Hosseini Maasoum and Guy Lichtinger, Generative AI as Seniority-Biased Technological Change: Evidence from U.S. Résumé and Job Posting Data, Harvard University, Department of Economics, working paper (Aug. 31, 2025; rev. June 6, 2026), SSRN 5425555 | 1B |
Derek DeBellis et al., DORA 2025 State of AI-assisted Software Development Report, DORA / Google (2025) | 1B |
Joel Becker, Nate Rush, Beth Barnes and David Rein, Measuring the Impact of Early-2025 AI on Experienced Open-Source Developer Productivity, METR (July 10, 2025) | 1B |
The Economist, The jobs apocalypse is postponed. An AI jobs boom is here (Sept. 4, 2026) | 1B |
U.S. Bureau of Labor Statistics, Software Developers, Quality Assurance Analysts, and Testers; Employer Costs for Employee Compensation (Professional, Scientific and Technical Services) | 1A, 2B |
Levels.fyi, Software Engineer Salary in the San Francisco Bay Area — median total compensation approximately US$280,000 (levels.fyi, accessed October 21, 2026) | 1A, 2B |
U.S. Bureau of Economic Analysis, Regional Price Parities | 1A |
Y Combinator, Software Engineer Jobs | 1A |
World Economic Forum, Future of Jobs Report 2025 | 1B |
LinkedIn, Jobs on the Rise 2025 | 1B |
The Diary of a CEO, interview with David Friedberg (youtube.com/watch?v=OYg6BTjb90E&t=4615s) | 1B |
GitHub Octoverse 2024 and 2025 | 2A, 2B |
IDB, World Bank and WTO, Digital Trade in Latin America and the Caribbean (2026) | 2A |
LAVCA, 2026 Latin American Startup Ecosystem Insights (lavca.org) | 2A |
Microsoft, 35 years in Brazil and 40 years in Mexico | 2A |
Google, 20 years of engineering in Brazil | 2A |
EF English Proficiency Index 2025 | 2B |
NIST, U.S. time zones | 2A |
Kearney, Global Services Location Index (2023) | 2A |
Indeed Hiring Lab, The Labor Market Is Tilting Toward Seniority (July 23, 2026) | 1A |
Indeed Hiring Lab, AI and Job Postings: From Destruction to Creation? (July 8, 2026) | 1A |
Oracle, Mexico Development Center | 2A |
Mercado Libre, company history and regional technology footprint | 2A |
Rappi Careers, engineering and data roles in Colombia (accessed Oct. 2026); about.rappi.com, countries of operation | 2A |
Nubank, company information and customer figures (international.nubank.com.br) | 2A |
Globant, 2025 Annual Report filing (investors.globant.com) | 2A |
TOTVS, history and company profile (ri.totvs.com) | 2A |
Robert Half, 2026 Salary Guide | 1A, 2B |
Ashby, 2026 Talent Trends Report, Recruiting Operations Benchmarks (ashbyhq.com/talent-trends-report) | 1A |
Evan Meyers, Plugg Technologies, video interview (youtube.com/watch?v=aDxvJO7cVqc) | 1B |
Nearshore Café Podcast: Kevin Haggard, Zengines AI; Paul Karaffa, Cloud Pacific; Ruben Santana, Plugg Technologies; Dave McClure, VC Investing in LATAM (2023); Stewart Wolfenson, Where Should You Outsource in 2025? (2025) | 1B, 2A, 2B |
Brian Samson, Plugg Technologies, video interview (youtube.com/watch?v=JE3LJPubYw4) | 2A |
Sandra Marquez, Talent Branding Lead, DoorDash & Zillow — Nearshore Café Podcast, unpublished interview provided by Plugg Technologies | 2C |
Plugg Technologies Applicant Tracking System and placement data | 1A, 2A |
Nearshore Café Podcast, Latin America M&A Outlook 2026 — Jean-Pierre Trouillot and Alan Riddell (plugg.tech/latin-america-ma-nearshoring-2026/) | 2B |